To say financial markets have been a wild ride recently is flattering to wild rides! The MSCI global index fell 33% in the space of a month, and to date has bounced 25% from its bottom, to currently sit 19% below the February peak.
Chart 1: the MSCI All Countries World Index
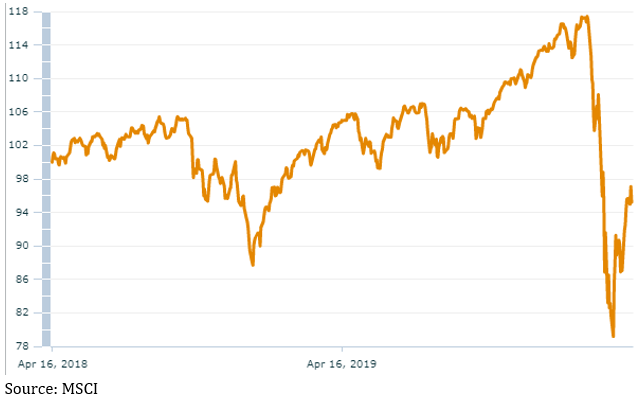
Along the way we’ve had all kinds of records set: the fastest ever decline to a bear market, the highest volatility since the GFC, the fastest bounce back, the best weekly gains, etc., etc. – it’s enough to leave your head spinning.
The extraordinarily strong rally in both shares and bonds over the past few weeks has left many scratching their heads after apparently disastrous economic data was being greeted with an enthusiastic bounce. There seems to be no shortage of reasons to be bearish, but markets appear to be telling the opposite story.
In the midst of the greatest economic shutdown the world’s ever seen, I thought it might be interesting to look at some of the reasons to be both bullish and bearish – which could well leave you sitting in the middle, confusedish.
The bullish arguments
Central banks
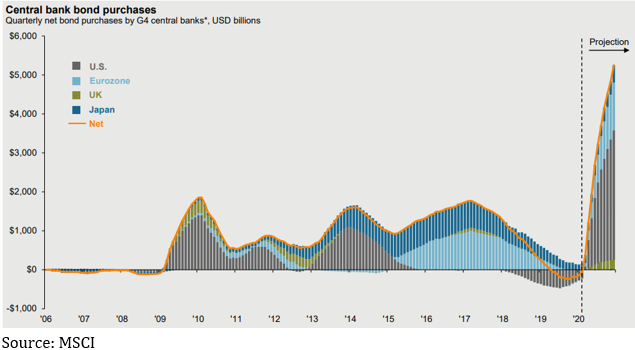
The single biggest reason to be positive is the scale of response we’re seeing from both central banks and governments to support stumbling economies, absolutely dwarfing what was thrown at them during the GFC.
This hit a staggering high last week when the US central bank, the Federal Reserve (usually referred to as the Fed), responded to jittery bond markets by announcing it would spend US$2.3 trillion to effectively backstop large companies by buying risky bonds that had lost their investment grade credit rating. That, together with some other never before seen moves, has created the perception of a lot less risk in bond markets, meaning credit, the lifeblood of modern economies, was able to flow once again.
Chart 2: After initially freaking out, bond markets responded to the Fed’s support measures
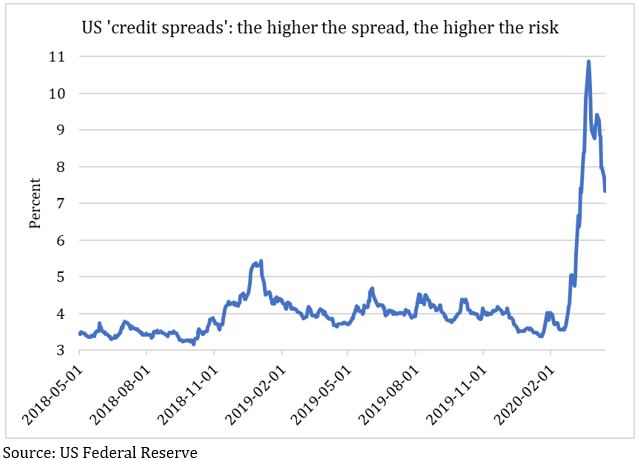
The Fed’s announcement underwrote a rally in bond markets that migrated through to shares as well, and stoked perceptions that no matter how bad things get for companies the Fed will bail them out. Other central banks, including our own Reserve Bank, have announced their own programs designed to make sure the financial plumbing in credit markets doesn’t get clogged up, with the tantalizing promise that they’ll do more if they have to.
Chart 3: Central banks have been far more aggressive than during the GFC
Governments
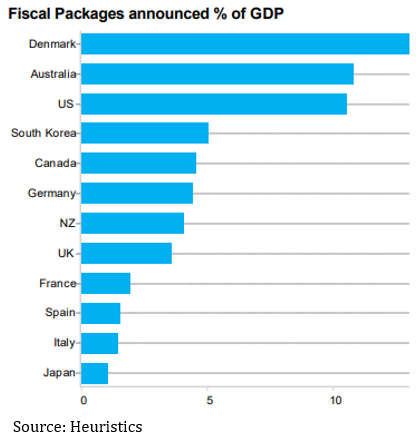
It seems as if a whole bunch of governments around the world, including Australia’s, have turned their ‘responsible fiscal spending’ rhetoric on a dime, and replaced it with talk of being ‘at war’. Perhaps the lessons of how ridiculously absurd fiscal austerity was in the wake of the GFC were in fact learned, with some simply massive programs unleashed along with, again, the promise of more to come if necessary.
Chart 4: Governments are turning on the fiscal tap
Importantly, the focus of support has been to make sure businesses go into hibernation rather than liquidation by supporting their employees so they don’t have to be sacked, and helping households navigate surviving the crisis.
The curve is flattening
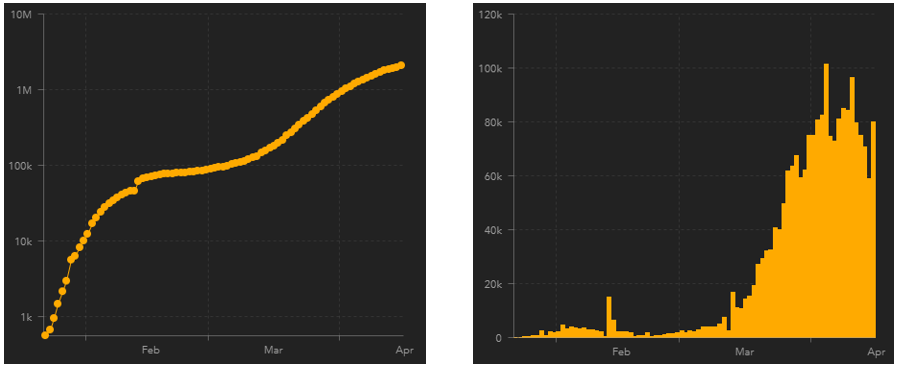
It must be the most talked about curve on the planet: the gradient of the growth in the number of confirmed COVID-19 cases across the world is flattening off, with strong indications that isolation and the unprecedented quarantining measures in place all over the world are working.
Chart 5: Global number of confirmed new cases and daily new cases
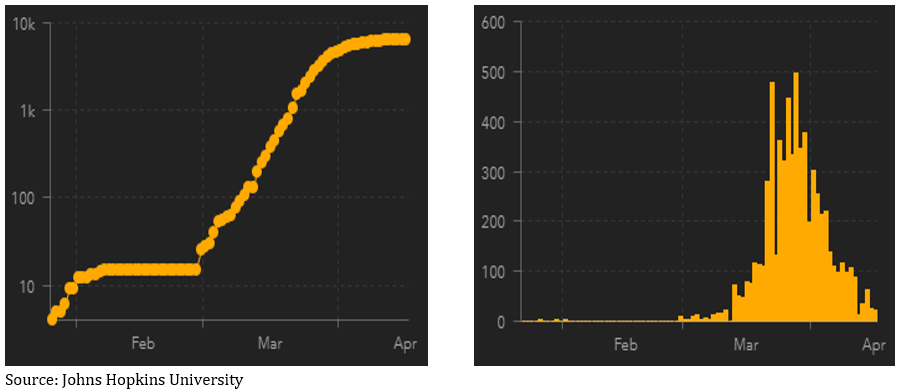
The same charts for Australia indicate not only are we getting on top of new cases, but we could realistically be looking at eradication in the next few weeks.
Chart 6: Australia’s rate of new cases is falling rapidly
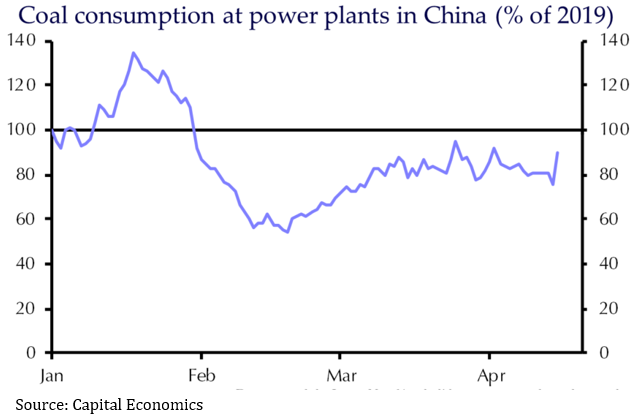
With the flattening of curves comes the ability of economies to reopen, as we’re now seeing in China, where a number of real time, high frequency measures are showing a strong and steady improvement.
Chart 7: China’s economy is coming back to life
Markets are forward looking
Share markets have a knack for very quickly factoring in what is known and then moving on to look for what we think we know. Obviously, the big swing factor is sentiment, which moves markets far, far more than facts, especially during a bear market.
The huge initial tumble starting in late February reflected the uncertainty from a scenario of great swathes of the global economy shuddering to a halt, and the subsequent bounce was optimism inspired by governments and central banks stepping up to the plate like we’ve never seen before. We all know unemployment will rise, spending will fall, and GDP readings will look ugly, that’s a given. But share markets don’t look much like the economy, so they can move quite independently, and the fact the US share market has powered on despite unemployment claims going through the roof shows you the market is looking through the curve to the other side.
We know the world will recover in due course, it’s just a question of when, and then markets will resume their inevitable onward march.
The bearish arguments
Government packages
There’s an old truism that financial markets hate uncertainty. Well, the list of unknowns is frighteningly long right now, with key amongst them that we have no idea when we’ll be able to give the go ahead to get the economy revved up again, meaning we also have no idea of just how much damage will have been done.
While the government spending packages are essential, they should be seen for what they are: rescue packages, not stimulus packages. There’s no way the government will be able to plug the entire hole where the economy used to be, and again we won’t know how big that hole is for a while yet.
Central bank measures
Undoubtedly central banks have played a key role in making sure liquidity didn’t dry up, ensuring money and credit are able to flow through the economy to where it’s needed. However, this crisis is going to move from being a liquidity crisis to a solvency crisis, especially among small to medium sized businesses. That is, it’s not going to be about businesses being able to get their hands on cash, it’ll be about having any business left.
The all-important consumer
Consumer spending accounts for about 60% of most developed economies, and discretionary spending is about 35% of that, so call it about 20% of GDP. How much of a hit will it take? Estimates of unemployment vary from 8-15% in Australia, which is likely to not only affect spending but could hit house prices too, which will have knock effects to spending again.
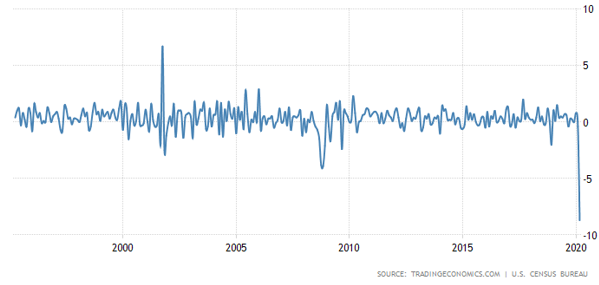
In the US, still by far the most influential market in the world, retail sales in March were down 8.7% from the previous month (which had been revised downwards), the biggest month on month decline since this data series began in 1992. And even that was possibly understating how bad things were given a lot of businesses didn’t respond to the survey because they were closed.
Chart 8: US retail sales recorded their biggest month on month fall ever
Other US data is ugly
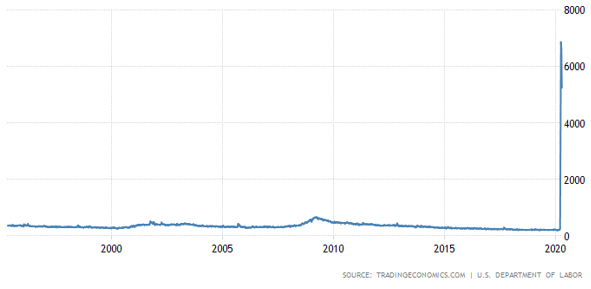
US unemployment claims have been eye wateringly high: as of this morning well over 20 million people had signed up in the space of four weeks, equivalent to 12.4% of the workforce. The US hasn’t seen anything like it since the Great Depression, and it’s pretty much wiped out all the job gains of the past 10 years. While a lot of those jobs will possibly reappear just as quickly, we can’t be sure all of them will.
Chart 9: recent US unemployment claims have jumped so high it makes the GFC look like a blip
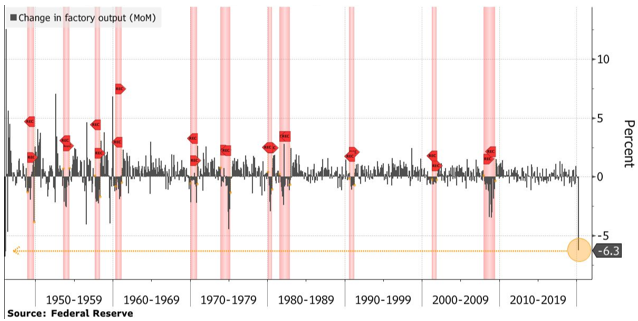
Similarly, US factory output dropped by more than 6% compared with February, the biggest decline since 1946.
Chart 10: US factory output dropped the most since the end of WW2
PE multiples
The Price to Earnings (PE) ratio is a basic measure of how expensive an individual share is, or you can apply it to an entire market. It’s simply the share price divided by the earnings per share, and the higher the number, the more expensive is the market. A higher PE is also a reflection of investors being more positive, or bullish, about the market.
There are two ways of looking at the PE ratio: the earnings that have actually been reported, which is called the Twelve Month Trailing PE (or TTM), or the forecast earnings for the next 12 months, which is called the forward PE. Right now, analysts have no idea what individual companies will earn, so they’re not willing to make a guess, which means the forward PE is not very helpful.
The PE ratio for the Australian All Ordinaries Index was 15.4 at the end of March. Just for comparison, during the GFC the Australian market’s PE ratio bottomed out at 9.3 in March 2009, 40% below where it is now. If we use US data (because unfortunately I don’t have the same data for Australia), in the seven nasty bear markets they’ve experienced since 1929, the PE bottomed at an average of 13.1.
Looking at it another way, the Australian PE was 20.1 at the end of January and comparing that to the March number it implies the market’s allowing for earnings to fall 23%. Again, using the US experience, earnings fell an average of 45% during those bear markets.
Confusedish?
It’s an absolute given that every bear market is different, with the huge difference this time that governments and central banks have responded like never before. Markets can be confounding, rising on bad news, and there are strong arguments on both sides. One thing’s for sure, on a long-term view, it’s never paid to bet against the irrepressible nature of human innovation.
A look at the reasons to be bullish or bearish, which could just leave you somewhere in the middle.


