
March 2021 quarterly outlook
Welcome to our Steward Wealth quarterly outlook video, a brief overview of where we see markets now and how we’re positioned.
Welcome to our Steward Wealth quarterly outlook video, a brief overview of where we see markets now and how we’re positioned.

Welcome to our Steward Wealth quarterly outlook video, a brief overview of where we see markets now and how we’re positioned.

It’s not uncommon to meet prospective clients who either forgot to make a concessional super contribution the previous year, or didn’t feel it was necessary.
However, all is not lost, with a little understood strategy which, in some circumstances, allows you to make ‘catch-up’ contributions.
The rules around catch-up, or more accurately known as ‘Carry-forward’ contributions, simply allow super fund members to use any of their unused concessional contributions cap (or limit) on a rolling basis for five years.
So, if you didn’t make the maximum concessional contributions ($25,000 in 2019/2020), you can carry forward the unused amount for up to 5 years. After 5 years, any unused concessional contributions will expire.
The first year these rules came into force and concessional contributions could be accrued from was the 2018/2019 financial year.
The Federal Government introduced carried-forward contributions to help those who have had interrupted working lives to get more money into superannuation. Those who had time off work to have children, care for children or loved ones, or even those who previously didn’t have the financial capacity to contribute to superannuation all benefit from these rules.
Anyone who has a total superannuation balance under $500,000 as at 30th June in the previous financial year is eligible to make catch up contributions.
Concessional contributions are those made from pre-tax dollars. It includes:
There is an annual $25,000 limit for concessional contributions.
This can best be illustrated with an example.
Tina has a total superannuation balance of $300,000. After taking a couple of years leave, she returned to work in July 2019.
During the 2019/2020 financial year, Tina was eligible to carry forward her concessional contributions she didn’t make in 2018/2019, however, she chose to not make an additional contribution above her employer contributions of $10,000.
So, for the 2020/2021 year, Tina has a total of $65,000 of eligible concessional contributions. She has done particularly well from her holding in Afterpay shares and decides to sell them giving rise to a significant capital gains tax liability. Tina has a meeting with her adviser at Steward Wealth about how she may reduce this tax liability. Her adviser recommends making full use of the carry-forward provisions and advises her to make concessional contributions totaling $65,000 (including her employer contributions). Not only will she receive a tax deduction for the contribution, but she will also grow her superannuation balance.

Carry-forward provisions are a real opportunity for those who haven’t been in a position to make contributions to superannuation, or who have simply forgotten to do so.
While it can assist in building up your retirement benefit, as you can see from our case study above, careful planning can also make it a very effective tax planning tool.
Superannuation can be very complex and advice really needs to be tailored to each individual. If you would like to discuss further, the Steward Wealth team are more than happy to assist you.
Call Steward Wealth today on (03) 9975 7070.
Inequality of incomes and wealth continues to be a well-deserved point of focus across the developed world. The US produces the best data, and by 2016 the top 1% of households held 29% of the country’s wealth, while the entire middle class owned 21% and real median income has fallen over the past 40 years. This inequality of wealth and income is actually reducing growth for the overall economy.
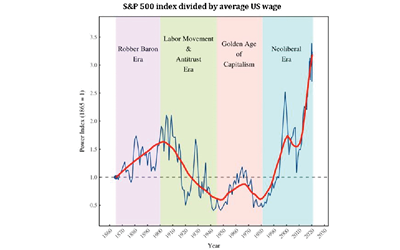
The chart below uses a simple, but insightful, method to argue inequality really took root under the ‘neo-liberal’ economic era. If it’s correct, that premise throws up some suggestions as to how it can be addressed.
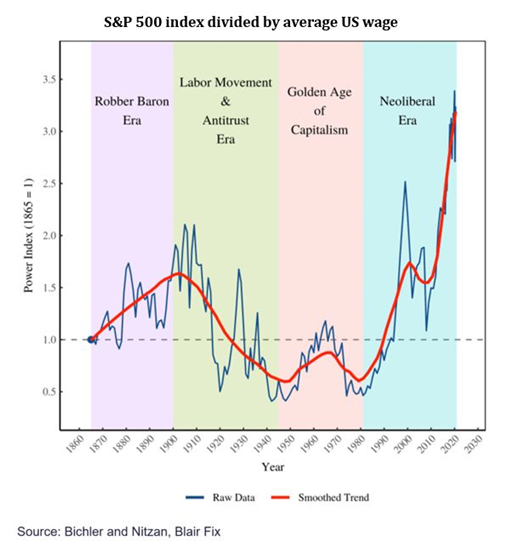
First, what is the chart telling us? It effectively traces the relative strength of labour versus capital. When the line is trending upwards, share prices, as measured by the US’s S&P 500, are rising faster than the average wage. That means there is a greater share of the economic pie going to the owners of capital than to labour.
After WW2 the US became the world’s factory and there was a relative scarcity of workers, so wages were strong. The next bottom in the chart, around the 1970s, was when unions were throwing their weight around and the US and UK lost a record number of days to strikes. Wages were commonly indexed to inflation, which created the classic wage-price spiral: as wages rose, so did prices, which again caused wages to rise, and so on.
Then came the era of Thatcher and Reagan, and the wholehearted embrace of neo-liberalism. This philosophy, which was largely founded on the work of Milton Friedman, argued markets are best at determining the allocation of resources so the best thing governments can do is get out of their way. It coincided with the crushing of unions, and the highest interest rates ever recorded as central banks around the world followed the US Fed Chairman, Paul Volcker, in his efforts to stomp out inflation.
Neo-liberalism is also called ‘supply side economics’, the premise of which is that reducing regulation and government interference would enable markets to flourish and encourage economic growth, and the benefits of all that growth would trickle down and be shared broadly. Indeed, Paul Volcker predicted that “wages for all Americans will improve as we achieve greater productivity and moderation in the demand for nominal wage increases.”
Well, that hasn’t happened. In his terrific book, The Economists’ Hour, Binymain Applebaum writes that “the median income of a full-time male worker in 1978, adjusted for inflation, was $54,392. That number was not matched or exceeded at any point in the next four decades. As of 2017, the most recent available data, the median income of a full-time male worker was $52,146. Yet, over those same four decades, the nation’s annual economic output, adjusted for inflation, roughly tripled.”
Likewise, economist Thomas Piketty argues that, in fact, the whole of the US is worse off under the neo-liberal model: between 1910-1950 national income per capita grew at 2.1% per year, from 1950-1990 it was 2.2%, and 1990-2020 only 1.1%.
In other words, as income and wealth inequality has worsened, so too has overall economic prosperity.
The solution? On the face of it, economies would be collectively better off if there was some equalisation of power between labour and capital. It also suggests there is indeed a role for government in areas like regulating labour markets and controlling corporate power.

This article appeared in the Australian Financial Review.
The amazing events of 2020 have been a great reminder that no two share market cycles are the same. The word ‘unprecedented’ has come to be all but worn out, whether it’s to describe the worldwide sell off in February and March, or the rebound in April and May, or the level of government and central bank support doled out along the way.
One thing that doesn”t change, however, is there is no shortage of experts competing to use history as a guide to explain why things just don’t make sense right now or will all end badly. Whether it be warnigns that valuations are too high, share markets are too reliant on a handful of companies, or market signals are being confused by central banks and governments, smart investors need to be wary of what have been called “experts on an earlier version of the world.”
Of course, there are some rules of investing that will always apply, but you also need to allow that markets are a constantly shifting mix of factors. Like ingredients in a recipe, if they are mixed in different proportions, you’ve got a whole new dish on your hands. Some new factor can seem to come out of nowhere and exert such profound influence that it all but squashes the last big trend into insignificance.
Take, for example, the common warning that share markets are expensive based on current price to earnings (PE) ratios compared to long-term historical averages. The price you pay for a share divided by how much that share will earn next year gives you a basic measure of how expensive it is: the higher the number the higher the valuation.
Based on earnings forecasts for the next 12 months, global shares are trading on a PE of 21, versus a 32-year average of 16. Likewise, Australian shares are on 18 versus 14, and the US is 23 vs 16. Nobody likes paying too much for something, and it can take years to recover from overpaying for investments.
However, it’s long been accepted that low inflation is supportive of higher PE ratios, and right now, inflation is much, much lower than it has been over the last 38 years. In fact, inflation and interest rates peaked around 1980 and have been in decline ever since. So it makes perfect sense that PE ratios would be higher now than they were over that long-term average.
One of the most commonly used techniques to value a company’s share is to do a discounted cash flow, or DCF, valuation. To do that you apply a ‘discount rate’, which is usually based on bond yields, against forecast earnings to see what they’re worth in today’s dollars. The lower your discount rate, the higher will be the present value of those future earnings and thus the higher the share’s valuation.
Right now, 10-year bond yields across the world are about the lowest they’ve ever been. So, again, it makes sense that valuations are higher today than they would have been at any time over the past 40 years.
What about those over-stretched US tech companies we keep hearing about? Again, the comparison needs to be kept in context. Once upon a time the market was dominated by companies whose costs went up in proportion with their sales. Industrial companies required bigger factories, supply chains and distribution networks to sell more widgets.
But now some technology-based businesses can expand their sales enormously without their costs increasing at all. That means the return on equity, which is a basic measure of profitability, for those businesses can be exponentially higher than their industrial counterparts, so it makes sense they will trade on vastly different metrics.
The problem here is an investor with a forty year career of investing in stocks with low PEs, because that’s what worked best for the previous 40 years, will understandably struggle to accept those high PEs are anything but an aberration from sensible valuations. Such an investor is almost undoubtedly an expert in an earlier version of the world.
They would never have bought Amazon shares five years ago when they were on a PE of 741, yet over that period the shares have risen more than six-fold and are still on a PE of 119. Evidently, when it comes to a company like this, a PE ratio is not the right valuation measure to use, and it’s ridiculous to argue the market has got it wrong for five years.
That doesn’t mean those investors won’t make money, it’s just that they’re unlikely to make as much money in today’s version of the world. With bond yields so low, an investment that offers apparently huge scope for growth with high profits becomes extremely attractive.
2020 will be remembered as an extraordinary year, with lessons for both the short and long term. The short-term lesson is just how difficult it is to second guess the market. No matter how certain we might be that something doesn’t make sense, Mr Market really doesn’t care what you think. The long-term lesson is that structural shifts in markets, like inflation and interest rates grinding lower and lower, can be hard to see while they’re happening, but the effects on markets can be profound.
While it’s smart to take on board the lessons from each cycle, we’ve seen time and time again it’s not so smart to presume history will simply repeat itself.