On 11 July, the US CPI data took the share market by storm. It was the fourth successive monthly decline, and at 3 per cent, it was the lowest annual inflation print in a year.
The fixed income markets had started 2024 expecting the US Federal Reserve would cut interest rates as many as four times over the year, but after some nasty surprises in March and April, there was even talk of another rate rise. The June print saw the odds of a September cut rocket and then the Federal Reserve Governor, Jerome Powell, all but confirmed it’s very much on the table.
So began what was being referred to as the Great Rotation as the market started to focus on those sectors and companies that would benefit the most from declining interest rates in an economy that was still expected to avoid falling into recession, and the hottest ticket in town was small cap companies.
The Russell 2000, one of two high profile US small cap indices, outperformed the NASDAQ and the S&P 500 by the most it ever has in a single day as well as over the following five days, rising by more than 10 per cent.
Then came the correction: higher than expected unemployment figures on 2 August saw perceptions about the risk of a US recession rise sharply, and the Russell 2000 gave back all those earlier gains.
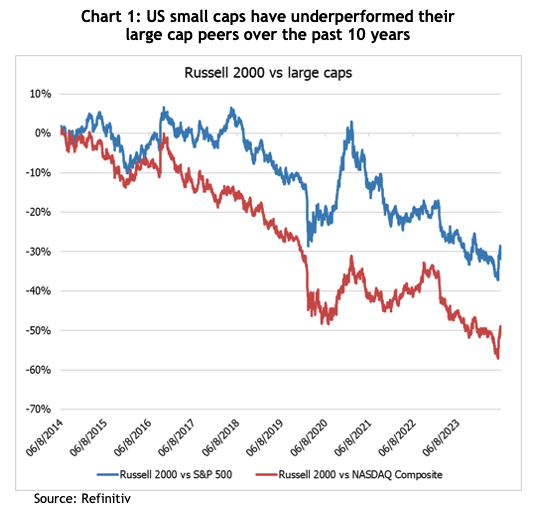
In terms of their performance compared to their large cap peers, small caps have endured a rough past 10 years, with the Russell 2000 underperforming the S&P 500 by 32 per cent and the NASDAQ by more than 50 per cent – see chart 1.
That outperformance by large caps has been underpinned by superior investment fundamentals, driven principally by the IT companies. Return on invested capital (ROIC) for large caps averaged about 10 per cent, double that of small caps, and free cash flow margins were 9 per cent compared to 2 per cent.
In other words, the large caps have been generating a higher return on every dollar they invest into their companies and ending up with more cash than their small cap peers.
On top of that, the small cap companies were, on average, carrying about four times the level of debt in proportion to their cash flow, so were more vulnerable to rising interest rates, especially given they averaged 40 per cent floating rate debt compared to the large caps at about 5 per cent.
But that was one of the reasons the Russell 2000 jumped so much when the market became convinced the next interest rate move is downwards, that leverage to interest rates becomes a good thing when they’re on the way down.
J.P. Morgan Asset Management recently wrote that a strong factor behind the small caps’ rally is that their valuations are as cheap as they’ve been this century, especially relative to large caps. The S&P 600, the other US small cap index, is on a forward PE ratio of 16x, versus a long-run average of 18x, whereas the S&P 500 is on 22x versus a long-run average of 17x.
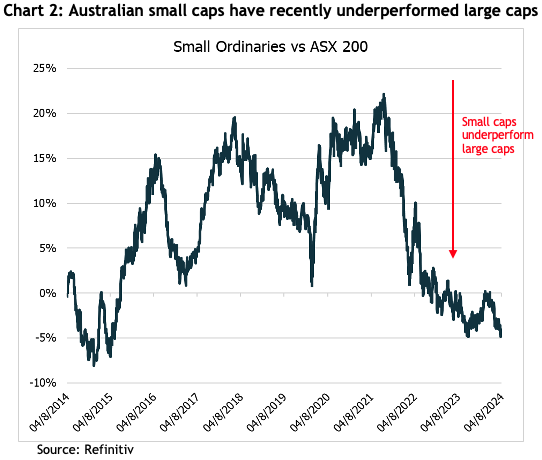
The story for Australian small caps is slightly different. The Small Ordinaries index outperformed the ASX 200 quite handily right to the end of the post-COVID bull market in 2021 but has since given it all back during the period of rising interest rates. That underperformance over the last three years is despite the Australian large caps not having anything like the fundamentals or earnings growth of their US counterparts.
The other consideration, of course, is that the Reserve Bank is not tipped to be cutting rates for a while yet, so more highly indebted companies are having to wait longer for relief.
So, are small caps still a bargain? The level of relative underperformance of Australian small caps versus large caps is almost as bad as it’s been in the past 30 years, and for the Russell 2000 versus the S&P 500, it’s about 20 years. If you’re a believer in mean reversion, you’d be looking for the catalyst and a reversal of the interest rate cycle might just be it.
On a straight PE ratio comparison, small caps again look cheap compared to large caps, but bear in mind the differences in fundamentals.
For smart investors who prefer a diversified portfolio, there’s always a solid argument for at least some weighting to small cap companies given that over the past 100 years they have, in total, handily outperformed their large cap peers. The phenomenal, albeit short, rally we saw in July is evidence that when small caps finally take off, they can move quickly.
Something to bear in mind about both US and Australian small caps is that one quarter of the companies in the Australian Small Ordinaries index, and about 45% of the Russell 2000, are loss making, so it’s one asset class where investing via an experienced fund manager with a strong track record can be beneficial.
Any advice on this site is general advice only and does not take into account the objectives, financial situation or needs of any particular person. You should obtain financial advice relevant to your circumstances and consider the Product Disclosure Statement before making any decision about a financial product. You should also note that past performance is often not a reliable indicator of future performance and you should not rely solely on past performance to make investment decisions.
In this article, James Weir explores whether the common practice of shifting investors into more defensive portfolios in their early 60s may reduce long term retirement outcomes.
James Weir explores the risks of letting politics influence investment decisions. He reviews historical data showing that, despite election noise and geopolitical events, markets often perform well in the long run. Could staying focused on a long-term strategy or reacting to political shift be the way to go for strong returns this time?