
At first, financial markets celebrated the election of Donald Trump as US president. But now it’s gone the other way, so what started as the Trump Bump has turned into the Trump Dump. So, what’s going on and what should you do?
From the day of his inauguration, in January this year, he has vigorously prosecuted his platform, in what can fairly be described as a pretty unorthodox approach, with a blizzard of executive orders and accompanied by the world’s richest man, Elon Musk and a very large chainsaw.
Regardless of your political affiliations, or how you view Trump, it’s not unreasonable to describe the outcome to date as chaotic. Tariffs have been announced and rolled back on several occasions, Musk’s Department of Government Efficiency (“DOGE”) has been sued by a number of state attorneys general, government programs have been summarily halted, thousands of government employees have been dismissed and there appears to be a wholesale realignment of post-war democratic alliances.
MARKET MOVES: EUROPE IS TRUMPING THE US
The US markets rallied hard immediately following the election. With the CEOs of all the tech giants and the mega banks sharing the stage at Trump’s inauguration, it was presumed life for them was about to get a whole lot better, with fewer obstacles to getting deals done and talk of unimpeded growth.
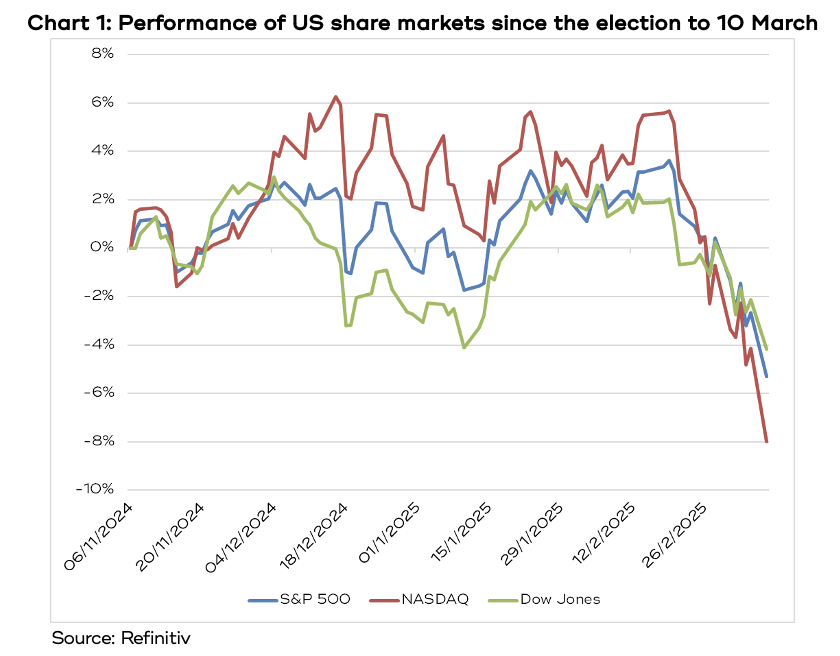
In just over a month after the election, the tech dominated NASDAQ index rose almost 6.5% to record highs and the S&P 500 hit a record high in mid-February.
By the end of 2024, optimism amongst investors also hit all-time highs and surveys of fund manager investment flows showed record amounts going into US shares, even though those same surveys quoted managers as saying the US was the most crowded trade, meaning everybody’s in on it, which begged the question of where the next dollar would be coming from.
Then, around 21 February, things changed for the US markets. As usual, there was no specific announcement, just a shift in sentiment that gathered steam. In the space of a couple of weeks, the NASDAQ dropped about 10% and the S&P 500 by more than 6%, more than wiping out the gains since the election – see chart 1.
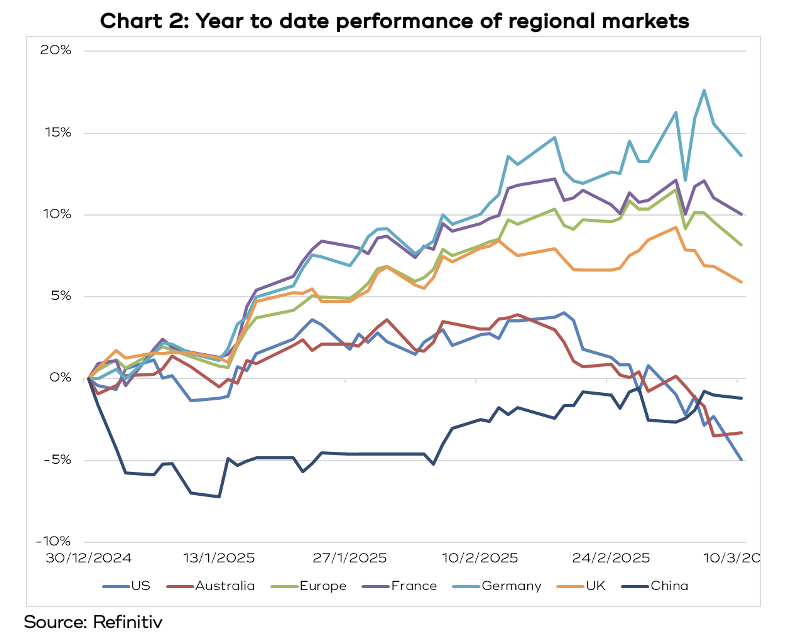
However, in a pronounced change from what we’ve seen over the past few years, the European share markets have risen strongly since the start of 2025, way outperforming the US – see chart 2.
WHY HAVE THE US MARKETS FALLEN?
There are, as always, a myriad of reasons that combine to cause a share market to go down, however, two readily identifiable reasons stand out.
Tariffs
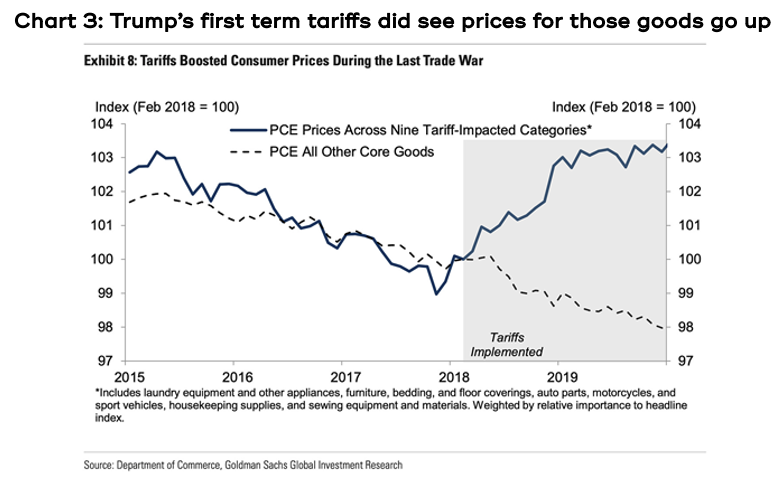
There’s endless debate about whether Trump’s proposed tariff program is going to be inflationary or not, which clearly scares the market and concerns the US Federal Reserve. His administrators and other proponents argue they won’t be, pointing to the very low inflation rate that prevailed during his first term, which also saw tariffs imposed.
However, Goldman Sachs points out that whilst the overall level of inflation during Trump’s first term did, in fact, remain relatively low, those goods that were subject to higher tariffs did indeed see an increase in price “by almost exactly the tariff amount” – see chart 3.
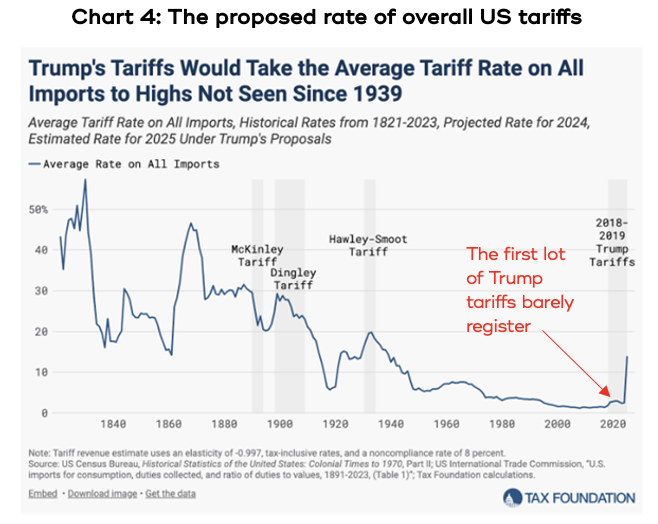
Critics argue this time the tariffs are far broader, such as the original announcement of a 25% tariff on all imports from the US’s two biggest trading partners, Canada and Mexico, and an extra 10% on all Chinese imports. Between them, those three countries account for more than one-third of the US$4.1 trillion worth of goods the US imported last year.
If all the proposed tariffs go ahead, which is a big if, the overall level of US tariffs would be at the highest level since the Great Depression and significantly higher than during his first term – see chart 4. If prices increase like they did last time, then that would be inflationary.
Again, tariff proponents argue that price increase would be a one-off, so the rate of inflation would quickly readjust. On the other hand, it’s possible that companies would use the tariffs as an excuse to keep raising prices, as happened during COVID.
The consensus view on Wall Street is that tariffs represent a net negative, reflected by David Kelly, chief global strategist for J.P. Morgan, who wrote, “The trouble with tariffs, to be succinct, is that they raise prices, slow economic growth, cut profits, increase unemployment, worsen inequality, diminish productivity and increase global tensions.”
As we’ve written many times, the most important thing for share markets is corporate earnings per share growth. J.P. Morgan has said if all the tariffs proceed it would cut their forecast earnings growth for the next year in half, though they add there is an enormous number of contingencies that could change the outcome, such as corporate pricing power, the currency and product substitution.
Probably even more disruptive than the imposition of the tariffs themselves is the haphazard way they’ve been introduced. There has been a pattern that tariffs get announced, then a few days later they are postponed, or modified, or particular sectors are exempted.
This has contributed to the economic policy uncertainty index hitting its highest level in 40 years, other than during the COVID crisis – see chart 5.
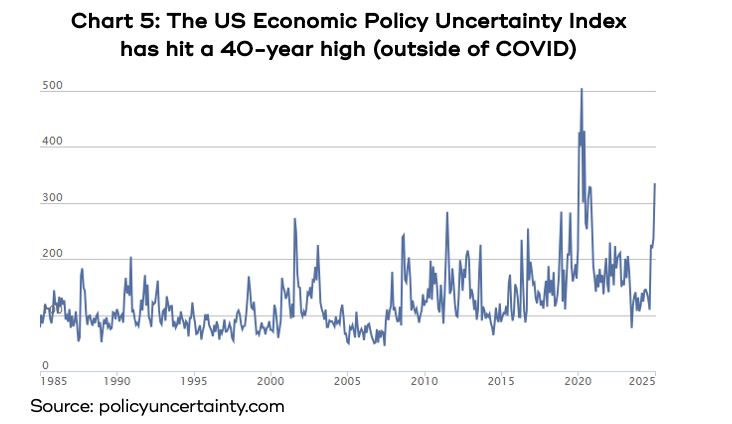
There is an age-old truism that markets hate uncertainty, largely because companies hate uncertainty because it makes planning very difficult.
One way of gauging the market’s view of potential inflation is through the 10-year bond yield. If the bond market thinks inflation is on the rise, then yields go up, and vice versa. Interestingly, after peaking in mid-January at 4.8%, yields have since fallen to 4.3%, indicating the bond market’s concern about inflationary risks have actually declined over the past two months – see chart 6.
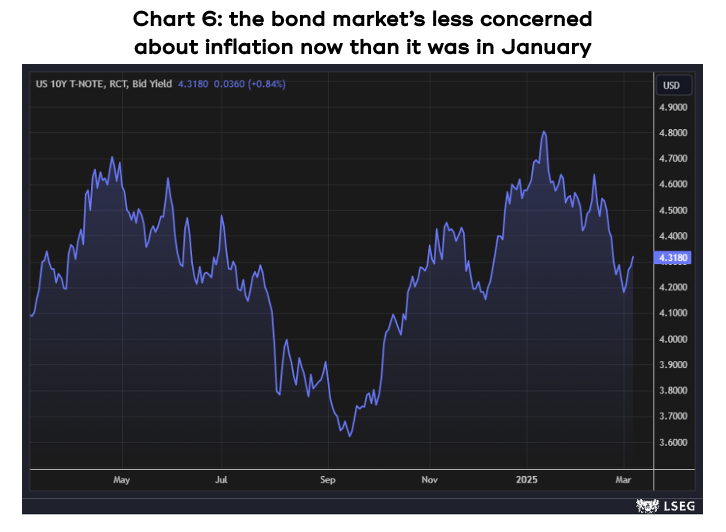
However, the reason for the declining bond yield and the reduced concern about inflation is generally attributed to the risk that economic growth is slowing. Which brings us to the second identifiable reason for the US markets falling.
The risk of slowing economic growth
We’ve written many times previously that one of the reasons the US economy has left the rest of the world in its wake over the post-COVID period was because of the relatively high level of fiscal spending. The US deficit has been running at around 7%, and corporate spending has been underwritten by the Biden administration’s CHIPS Act, Infrastructure Act and the Inflation Reduction Act.
The Trump administration has promised to dismantle as much of those Biden policies as it can. On top of that, Musk’s DOGE is on a mission to cut government spending by up to $2 trillion. So, much of that fiscal impulse is under threat of being withdrawn, which will inevitably slow US growth.
However, despite the threat of Musk’s big chainsaw, according to the Daily Treasury Statements, US government spending has not materially changed since last year, in fact, it’s gone up slightly. That doesn’t mean it won’t change in the future, and the market is always forward looking.
Another important indicator for the US economy is consumer confidence, and the market was shaken by the latest data showing a third consecutive monthly decline, and the biggest monthly fall since August 2021 – see chart 7.
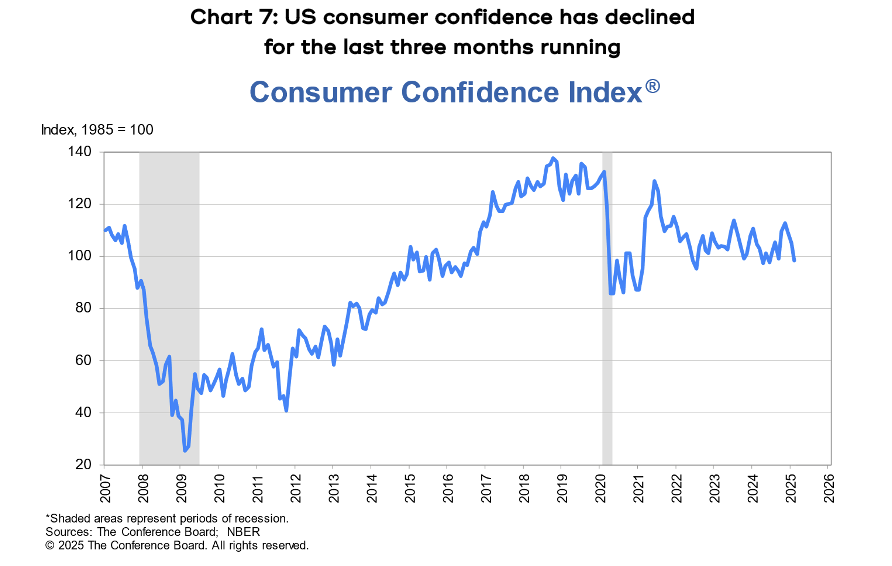
The significance of a drop in consumer confidence is that consumer spending accounts for almost 70% of US GDP, so if people decide it’s better to be a bit cautious, it can have a real effect on growth.
WHY IS EUROPE GOING UP?
The Trump administration has upended the post-war order, where Europe had come to rely on US protection, causing existential angst at a time when Russia is seen as posing an expansionist threat. This has resulted in various European leaders talking about the need to increase military spending, which is also exactly what the Trump administration has been asking them to do, even harking back to his first term.
Just as we’d argued the US economy had done well because of its high level of fiscal spending, likewise we’ve argued for a long time that Europe has been suffering due to a lack of spending. This now appears to be reversing.
Germany, Europe’s biggest economy, has been mired in recession for almost two years, but successive governments have been labouring under a ‘debt brake’ that restricts government borrowing to 0.35% of GDP. At the same time, its vaunted auto sector has been under siege by the growing Chinese EV makers, and now the US is threatening tariffs.
Following recent German elections, the parties that are in talks to form a coalition government have proposed that any increase in defence spending above 1% of GDP will not be counted toward the debt brake. It’s estimated they will need to spend up to 3.5% of GDP to replace the US’s contribution.
At the same time, the coalition has proposed a €500 billion infrastructure fund that its different states will be able to access. It’s all sufficient for Goldman Sachs to increase its forecast for GDP growth in 2025 from 0.2% to 0.7% and for 2026 from 1.5% to 2%.
Additionally, France, the UK and other countries are also talking about increasing defence spending.
The prospect of governments opening the spending spigots has seen the European share markets rally strongly, especially the defence contractors. Indeed, the Europe Aerospace and Defence Index has risen 29% so far this year and 46% over the past six months.
Investment banks are rushing to upgrade their forecasts for the European economies and share markets and fund manager inflows have increased sharply as well.
WHAT TO DO FROM HERE
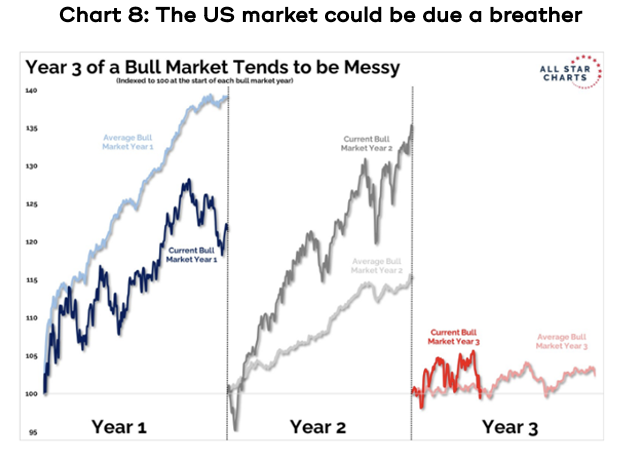
Firstly, as always, unfortunately nobody can tell you how much downside risk there is to US markets. The last couple of years have delivered exceptional returns, and it may be that we’re due for a breather, which wouldn’t be unusual for the third year of a bull market – see chart 8.
It’s also important to remember that over the past 44 years, the average intra year decline on the S&P 500 has been 14.1% – meaning the average year usually sees the market pull back by that amount at some point, but they inevitably recover.
This is also why we advocate diversified portfolios. Most of the international funds we invest in have some weighting to Europe, albeit typically less than the US weighting.
Secondly, there’s also no way of knowing if the Europe trade has much further to go. If you do fancy getting some exposure, there are Europe ETFs available on the ASX: the Vanguard FTSE Europe Shares ETF (VEQ), the iShares Europe ETF (IEU), the Betashares Europe hedged (HEUR) and Global X Euro STOXX 50 (ESTX).
And for those who believe the prospect of global rearming will be ongoing, VanEck has the Global Defence ETF (DFND).