
I know what you’re thinking: you’d have to be crazy to believe we’ve seen the last of potentially market-crunching pronouncements from the Trump administration. The share markets aren’t so much gripped by complacency as blind hope.
And yet, from its recent bottom on 8 April, the S&P 500 rose by 19.7 per cent over the following 28 trading days and is currently only 3 per cent from its all-time high.
The bounceback by the US sharemarkets has been one of the fastest in history, which has added to the sceptics’ concerns that it’s been the so-called ‘dumb money’, that is, retail investors, who have driven the rally by blindly buying the dip, while the institutional and hedge fund managers have been more cautious.
As always in times of elevated market volatility, the question on every investor’s mind is whether we’ve seen the worst. And, as always happens in times of elevated market volatility, baked-in human biases influence our thinking and affect our objectivity.
There are a bunch of indicators that suggest we may have seen the worst for the US markets. Many of them are based on what’s called ‘breadth’ analysis, which looks at the proportion of stocks in an index that have gone up versus down. The higher the proportion going up, that is, the more positive is the breadth, the more bullish is the signal.
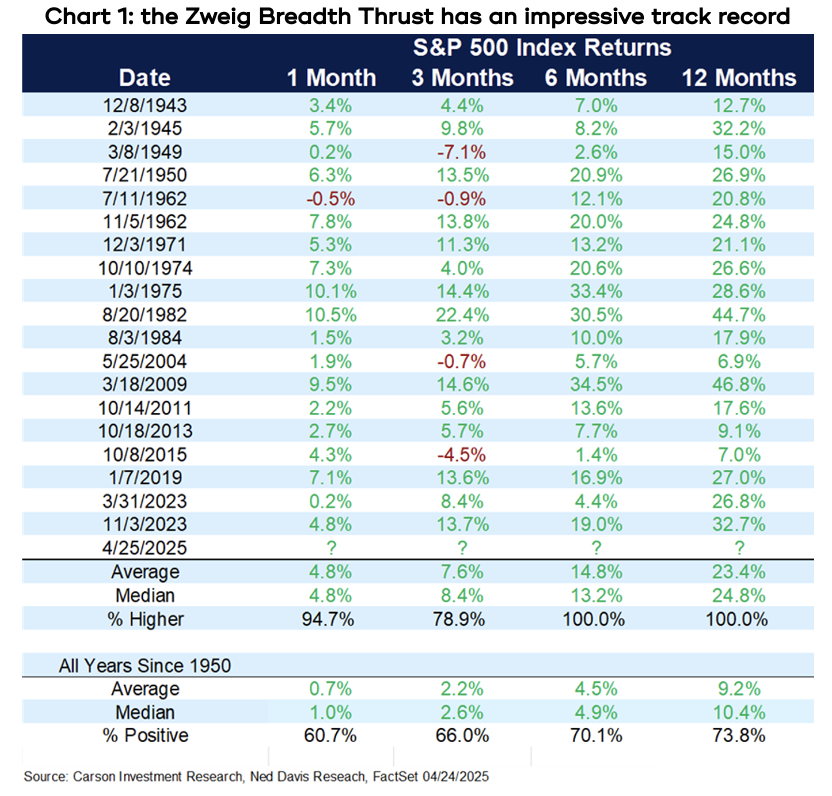
There’s one that is particularly interesting, which has the formidable title of the Zweig Breadth Thrust. Marty Zweig was a high-profile financial analyst from the 1970s through to the 1990s.
This indicator has been triggered 20 times since World War 2, the latest being on April 25 of this year. On each occasion, there have been positive returns in following six-month and one-year periods.
Across the previous 19 occurrences, the average increase in the S&P 500 six months later has been 14.8 per cent (versus 4.5 per cent in an average year), and 12 months later it has been an average of 23.4 per cent higher (versus 9.2 per cent).
Plus, the ZBT has had a 100 per cent ‘strike rate’ – in other words, the market has gone up all 19 times the indicator has been triggered (versus a 72 per cent likelihood of going up in an average year)- see chart 1.
The difference in the level and consistency of returns between the sample years versus the average years is significant enough to argue it’s signal rather than noise.
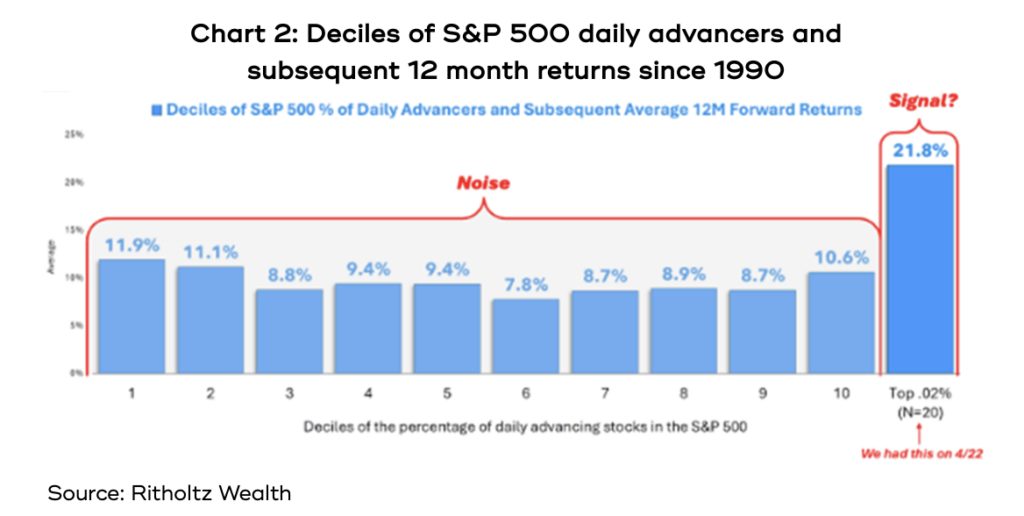
A second notable breadth indicator triggered on April 22, when 98.2 per cent of the companies in the S&P 500 went up on that day. That puts it in the top 0.02 per cent of days of positive breadth.
If you break down the positive and negative breadth days by deciles – that is, the top 10 per cent of days when the most stocks rose through to the bottom 10 per cent when most fell – and look at how much the index has risen over the following year, there’s no discernible pattern. It sits between 8 per and 12 per cent, so it’s just noise.
But if you look specifically at the 20 days since 1990 that sit in that top 0.02 per cent, the average 12-month return afterwards was 21.8 per cent. Again, that difference is so significant that you can argue it’s a signal.
Now, if there were only two examples of these indicators, you’d be justified in treating them as interesting, but not necessarily convincing. But there are more, a bunch of which are summarised in chart 3.

For example, 22 April also marked the second time in nine days when the New York Stock Exchange recorded more than 89 per cent of stocks both going up in price and seeing an increase in trading volume. That has happened on four previous occasions since 1980, and every time the S&P 500 was higher both six and 12 months later, with an average 6-month increase of 24.7 per cent, while over the following 12 months it averaged a whopping 31.2 per cent increase.
Another was triggered on 12 May, when more than 58 per cent of the companies in the S&P 500 made a new 20-day high. That has happened on 20 previous occasions since 1950, and six months later the index had gone up by an average of 9.7 per cent, with a ‘strike rate’ of 85 per cent (17 out of 20 times), and for 12 months the average increase was 18.7 per cent, with a 100 per cent strike rate.
Cynics might dismiss these indicators as fun with numbers, or data mining. But I think they’re worth paying attention to because while the cause of market volatility is different every time, tariffs, pandemics, debt crises, etc, the psychology behind how crowds react never changes. These indicators reflect that crowd psychology.
You can back up these indicators that are based on trading data with what’s happening in the news as well. It appears President Trump is paying more attention to the signals coming from financial markets, including sharp falls in the share markets and sharp rises in US bond yields.
Part of the reason for that may be that Trump is listening more to the Treasury Secretary, Scott Bessent, who was a very successful hedge fund manager for 40 years before joining the administration and would be very adept at reading the signals the financial markets are sending, and who is now the go-to guy for communicating financial policies.
At the same time, Peter Navarro, who was the architect of the tariff program and refused to countenance opposing views, has been sidelined and has all but disappeared from view, which reduces the likelihood of Trump wheeling out another set of potentially market-wrenching proposals like he did on so-called Liberation Day.
There is still a lot of anxious debate in the media that the market appears to be ignoring the likelihood of earnings downgrades coming from the still higher tariffs that are in place; that policy uncertainty is so high that companies will opt to do nothing and investment will dry up; that consumer spending will evaporate in the face of tariffs causing higher prices; that US stocks are already trading on relatively high valuations.
You can always find bearish arguments, but if the media’s talking about them, and analysts are writing about them, then you will usually find the market, which is an incredible forward looking indicator that somehow synthesises all the information swirling around at any point of time, has already factored them in.
Think back to the COVID selloff, the market fell 34 per cent in only 24 trading days, and was back within 4 per cent of its highs only 53 days later, by which time we still weren’t even certain how the virus spread, let alone having any ideas about vaccines and restarting economies.
The indicators we’ve looked at aren’t magic, and we haven’t looked closely at the range of past outcomes, only the averages. It’s also pretty much certain there will be more volatility to come because markets don’t go up in straight lines. However, a smart investor can take comfort that there are good reasons to stick to a long-term plan.