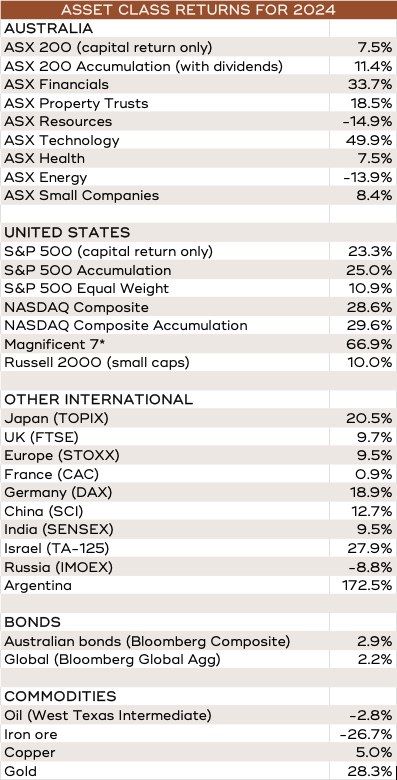
2024 – THE SCORECARD
Financial markets have a way of taking people by surprise, and 2024 was no different. After delivering above average returns in 2023, forecasters were expecting a reversion to mean, instead, it was another banner year, with rampaging mega cap tech stocks once again catching the limelight.
In 2023, the US’s S&P 500 rose by 25.1%, and at the start of 2024 both the average and median forecast across more than 20 market commentators was for a pedestrian 2% return, but it came in at 25.0%. Japan also delivered a second consecutive year above 20%.
A critical difference from 2023, however, is that last year a much higher proportion of the return in global share markets was delivered by earnings growth plus dividends, which together are the ‘fundamental’ drivers of a company’s share price, rather than just a higher PE (price to earnings) ratio, which is simply a reflection of sentiment. The glaring exception to that was Australia, where earnings growth was negative for the second year in a row, and sentiment was by far the biggest contributor – see chart 1.
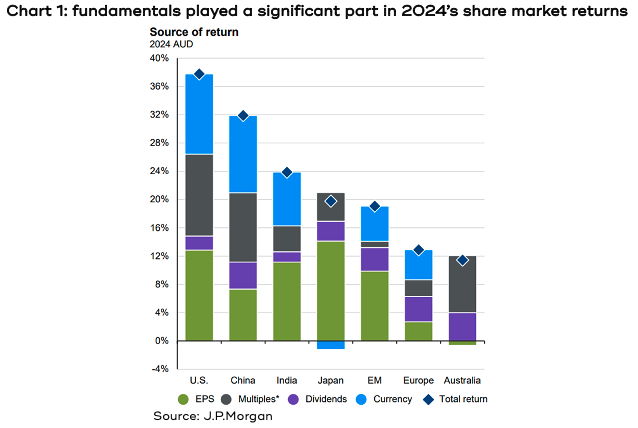
As always, it’s hard to put your finger on exactly why sentiment was so positive, but a good guess is that it was from a combination of PE ratios tending to expand in bull markets, plus the hype/excitement around AI, which is not only underwriting huge earnings growth for a bunch of the mega cap tech stocks in the US, but is spreading the love to other sectors catering to higher energy demand. As for why that would spread to Australia is far less clear.
Last year was also marked by a lack of volatility. The US Volatility Index (aka the VIX) was almost 20% below its post-COVID average, while the Australian VIX was about 12% below. That was reflected in the ASX 200 copping only a 6% drawdown (that is, the biggest intra-year fall) through the year versus a 30-year average of 14%, while for the US it was 8% compared to the same long-term average of 14% (though an interesting factoid is that the average drawdown for companies across the whole S&P 500 in 2024 was 21%).
A YEAR OF POLITICAL UPHEAVAL
2024 was the biggest election year in history, with 3.7 billion people casting votes across 72 countries. It was also a year of upheaval, where the incumbents in every single one of the 10 major countries that held national elections in 2024 were given a kicking by voters. This is the first time this has ever happened in almost 120 years of records.
Of course, the most impactful result was the re-election of Donald Trump as US president, which introduces all kinds of questions for the next two years at least (more on that below). But by the end of the year the two European powerhouses, France and Germany, were locked in political standoffs, South Korea was in chaos and Japan saw yet another prime minister forced out by scandal.
Throw in two ongoing international wars as well as multiple regional armed conflicts like Sudan, Myanmar, Yemen and Haiti, and you can be left wondering how on earth financial markets managed to go up at all.
The answer is: markets will carry on until the conflicts affect earnings growth. As yet, that hasn’t happened, and in a country like Israel, where companies are making money hand over fist due to the massive increase in government spending, the share market boomed (+28%).
INFLATION
Most commentators attribute much of that shift in the political winds to voters being deeply unhappy about the cost of living, which has rocketed since the onset of COVID in 2020.
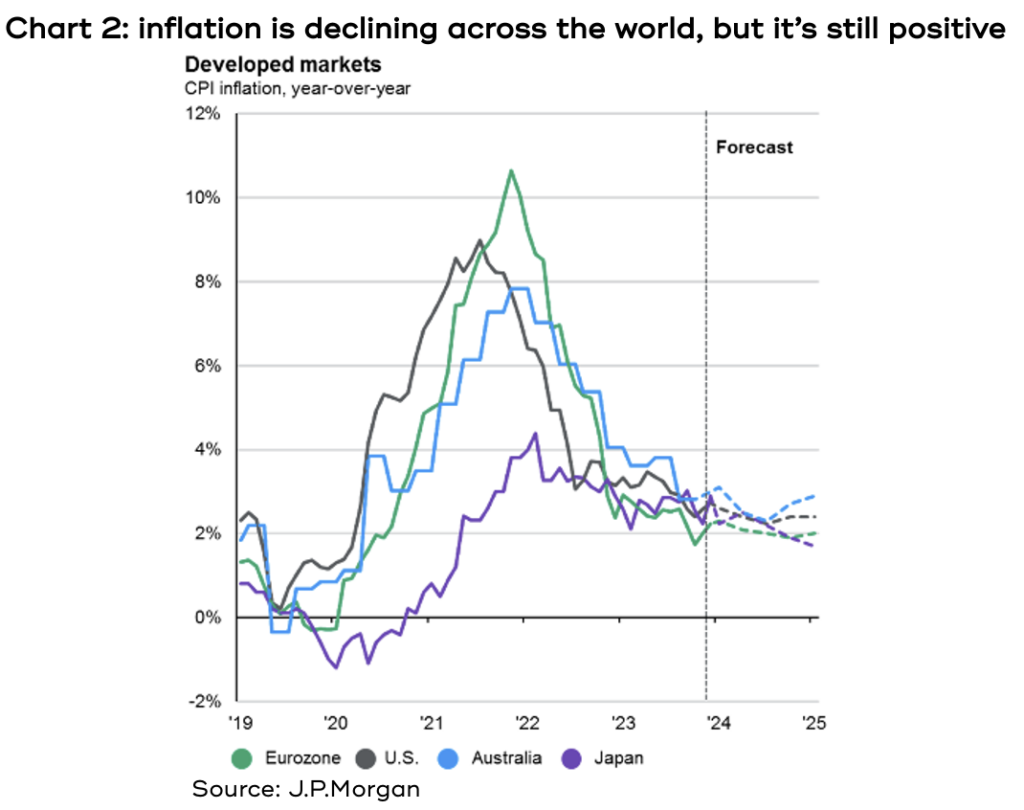
Whilst the rate of inflation has fallen across the world, prices are still going up, just not as quickly – see chart 2. And more critically, those prices people feel every day as they try to feed their family, or pay their insurance or energy bills, or medical costs, aren’t coming down.
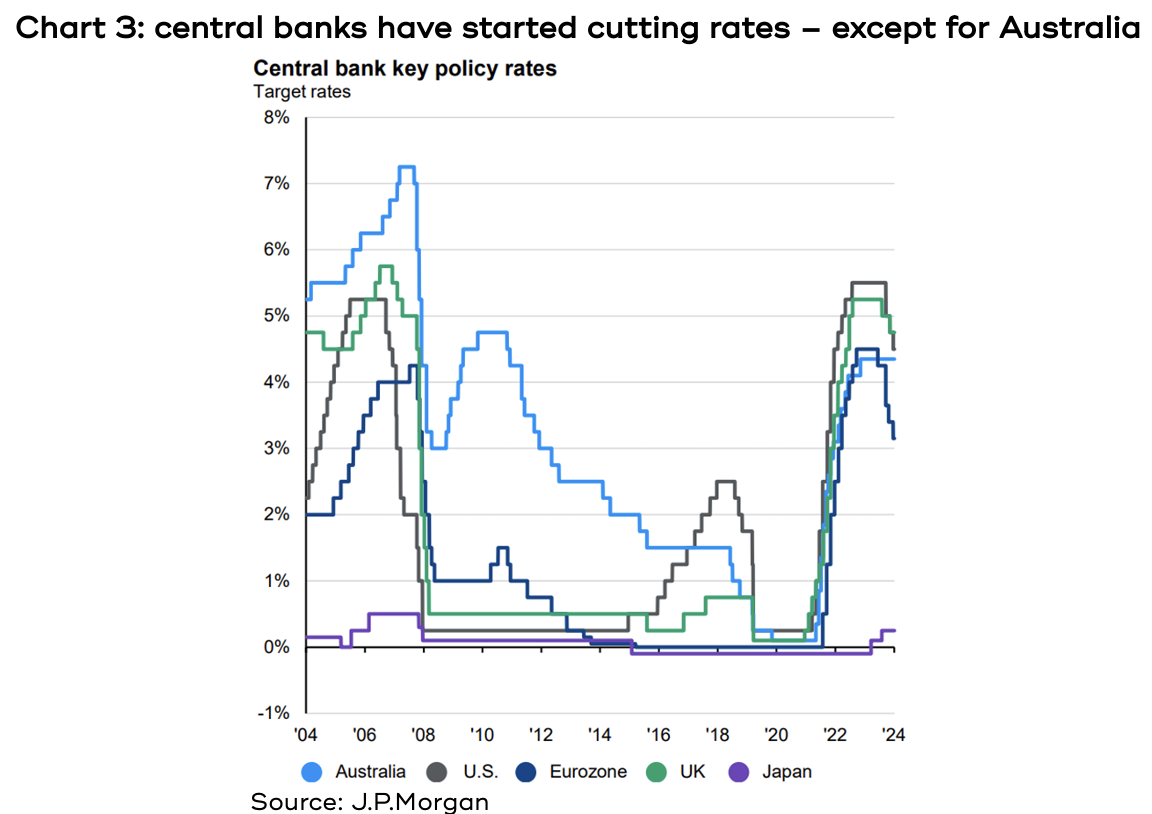
By the end of last year, 12 major developed economy central banks had started cutting interest rates, something that provided a tailwind to financial markets – see chart 3. A standout exception, of course, was the Reserve Bank of Australia, leaving those with a home loan still suffering the biggest increase in living costs: their mortgage payments.
With a federal election having to be called before May, it will be interesting to see if the Albanese government suffers a similar fate to the incumbents of last year.
AUSTRALIA
The ASX delivered a return of 11.4% in 2024, which compares to the average of 13.5% since 1950. Whilst that return may be a little disappointing, it was despite recording negative earnings growth.
The standout story of the year was the banking sector, which went up 35%. In fact, the banks contributed 6.5% of the 11.4% total, and Commonwealth Bank on its own accounted for 3.5%. Exactly why the bank shares rose so strongly has left analysts scratching their heads. The average earnings growth for the big four, ANZ, Commonwealth, National and Westpac, was -4%, and the forecast for next year is about +3%, and while the dividends were healthy, it really meant a massive part of the rise was simply PE expansion – see chart 4.
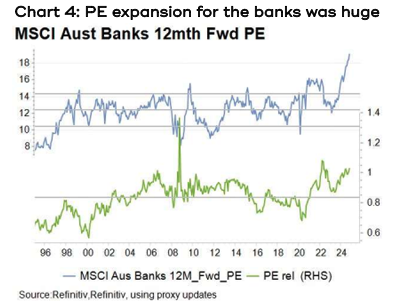
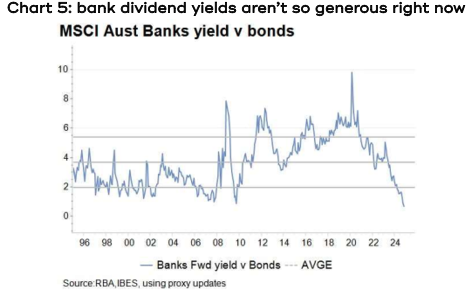
In the past, of course, you could always rationalise holding the banks because of a generous dividend yield, but after the strong rally, it’s not looking quite so rosy – see chart 5.
Some fund managers, typically those that have underperformed the index because they’re underweight the banks, blame the rise of passive investing, where ETFs blindly buy the biggest companies in the index with no regard to valuation. However, if that was the reason, then BHP and CSL should have gone up in lockstep, but instead they were down by 16% and 2% respectively.
Morgan Stanley has worked out that the share of the bank sector owned by the biggest industry superfunds has increased from 27% to 30% over the past two years, a rate of growth 2.5x what it had been over the previous 10 years. So it could well be the best explanation for the strong rise in bank share prices is simply the firehose of superannuation money that just keeps coming month after month, colliding with a distinct lack of individual shareholders willing to let go of their bank shares.
As for the outlook for Australian shares, we believe there are reasons to be cautious. At a macroeconomic level, the news isn’t pretty:
- Over the last six quarters real GDP growth has averaged less than 0.3%.
- Real GDP per capita has declined in each of those six quarters, which has never happened before.
- The annualised GDP growth rate after the September quarter was 1.2%, the lowest annual rate in 30 years.
- If it weren’t for government spending, Australia would have been in recession.
- 9% of our GDP comes from exports to China, which is struggling.
With respect to the share market, there will always be some parts of the market that do well, but from an overall index point of view:
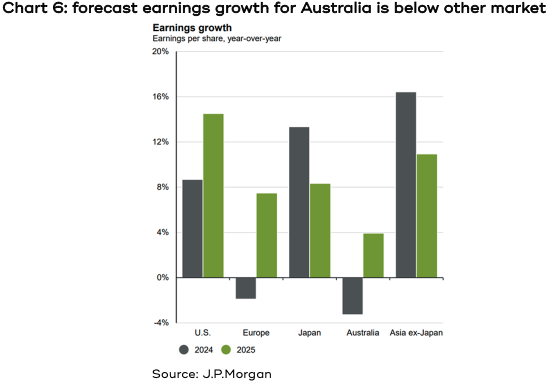
- Earnings growth for 2025 is forecast to be about 4%, which is amongst the lowest in the developed markets – see chart 6.
- We’ve already had two consecutive years where the bulk of share market returns was due to positive sentiment (PE expansion), and we’re very unlikely to see bank share prices rise another 35% in 2025.
- The forecast dividend yield is 3.5%, compared to the 20-year average of 4.5% (not including franking).
- The market is trading on a forward PE ratio of 17.8x, which is more than 20% above its 20-year average. Unlike the US market, the composition of the ASX 200 is not so different to what it was 20 years ago to make the comparison useless – it’s still dominated by banks and resources.
- A potential positive is the likelihood of the RBA cutting interest rates this year, though the market has a way of pricing that in well ahead of the event.
PE ratios don’t normally fall much outside of a recession (see below), so whilst the current PE may not go down a whole lot, it’s difficult to expect it to expand a great deal in a lacklustre earnings environment.
In summary, our Investment Committee remains underweight Australian equities in multi asset portfolios.
UNITED STATES
The US is not only one of the best performing markets in the world, but also by far the most influential, so it’s worth paying close attention to what’s going on there.
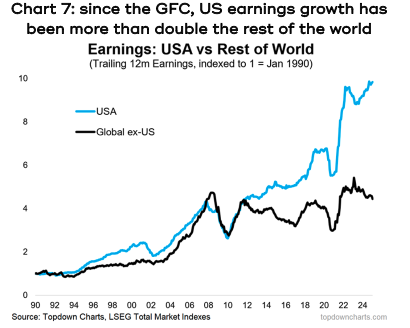
It’s difficult to throw enough superlatives at the US economy and share market, which in some ways is because the competition is pretty lousy. In terms of GDP growth, it has trounced the rest of the develop world and most of the emerging economies, and since the GFC, it has delivered more than twice the earnings growth of the rest of the world – see chart 7.
The strong 2024 return of 25% for the S&P 500, together with very low volatility, saw the index hit a new all-time high every four trading days!
It was once again led by the mega cap tech stocks, in particular the so-called ‘Magnificent 7’ (Apple, Amazon, Facebook, Google, Microsoft, Nvidia and Tesla). Without them, the index would have only risen by 6.4% last year, though interestingly, Nvidia was the only one of the seven to make it to the top 10 performers, and one of them, Microsoft, ‘only’ returned 12%.
Another telling signal that the index was driven by the biggest companies is that only 19% of stocks in the S&P 500 actually outperformed the index.
Having delivered back-to-back gains of 25%, it’s only reasonable that investors would question whether the good times can keep rolling for the US share market, and likewise question why our Investment Committee continues to remain overweight the US market. Let’s look at the most popular arguments.
The US market is too expensive
The S&P 500 is currently trading on a forward PE ratio of 27.4x, compared to a 20-year average of 19.2x, so that’s a chunky 43% premium – see chart 8.
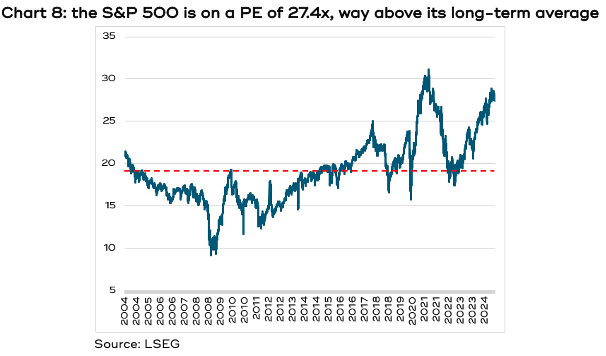
First, if you exclude the Magnificent 7 mega cap tech stocks, the PE ratio for the other 493 companies in the S&P 500 drops to 19.0x, which is, in fact, just slightly below the long-term average.
Second, the IT sector, which trades on a much higher PE ratio, currently accounts for 32% of the total index, whereas only 20 years ago it was about 16%. Likewise, today the financial and energy sectors, which trade on a much lower PE ratio, account for 17% of the index, whereas it used to be closer to 30%.
In 1980, ‘innovation’-based companies accounted for only 14% of the index, in 2004 it was 35%, and in 2024 it was 49%.
What’s more, if you look at other metrics, it’s evident the quality of the overall index has improved significantly from 20-30 years ago. For example, gearing (net debt/equity) has declined from 140% to about 60%, and profit margins for the whole index have almost doubled from 5.5% in the 1990s to 10.5% today.
In other words, comparing today’s market to 20 years ago is the proverbial apples vs oranges, so it makes sense that would be reflected in the PE ratio.
Why should the tech companies trade on such a high PE?
The tech companies are what’s called capital-light, meaning the amount of capital they have to spend to generate an extra dollar of revenue is less than the old-fashioned industrial companies.
As you can imagine, once Microsoft has created its software, the company doesn’t have to spend a whole lot more money to blast it out via the internet and gaining extra customers doesn’t require extra capital to be outlaid.
Compare that to a manufacturing company that makes widgets. Its revenues are constrained by how many factories they have, and if they acquire more customers, they have to build expensive new factories and pay distribution costs. Its profitability and earnings potential are wildly different to Microsoft, so it’s only fair that’s reflected in a different PE ratio.
Also, accounting rules were designed decades ago when economies were dominated by the old smokestack industries. Money spent on research and development (R&D) still has to be written off as an expense, despite forming the foundation of future earnings growth, so arguably it should be seen as an asset, or capital item. The same goes for marketing.
The share market has a way of working out how much of that expensed spending should be added back to reported profits because it contributes to future earnings.
The market has become very concentrated
The inexorable rise of the mega-cap tech stocks has meant the weighting of the top 10 companies has more than doubled in just the past 10 years to about 38%, the highest in at least 50 years – see chart 9. Bears caution that creates concentration risk.
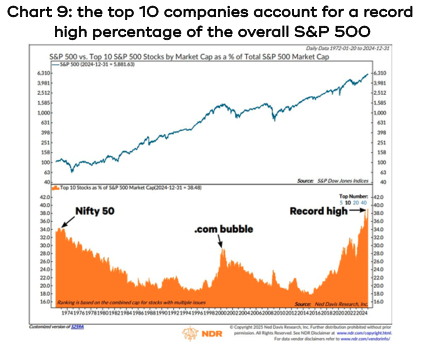
First, is that growth justified? Over the three years to the end of 2025, the top 10 companies are expected to deliver a total of 83% earnings growth, whilst for the remaining stocks it’s just 9%. Also, the free cash flow margin of today’s top 10 stocks is a whopping 27%, whereas in the 1990s it was 10%.
Second, Australian investors should be well aware that having a high proportion of an index represented by the top 10 is not at all unusual. The top 10 companies account for more than 60% of the ASX 200, and the average across the 21 biggest markets in the world is 58%.
Goldman Sachs analysed whether there was any relationship between market concentration and subsequent 12 month returns, and found there was none. Not only in the US, but in the UK, Germany, Japan or, at a broader level, the Eurozone, and indeed all developed markets.
Isn’t AI in a bubble?
There’s no question that the launch of Chat GPT in November 2022 set a fire under the US share market, however, any comparison to the dotcom bubble of 2000 is way off the mark.
Chart 10, which traces the historical earnings growth of the US tech stocks against non-tech, illustrates two points. First, the gap between the tech and non-tech companies back in 2000 was not especially great, but the price differential was enormous. That was because the tech stocks traded on sky-high PEs, inflated by fanciful ideas of blue-sky potential.
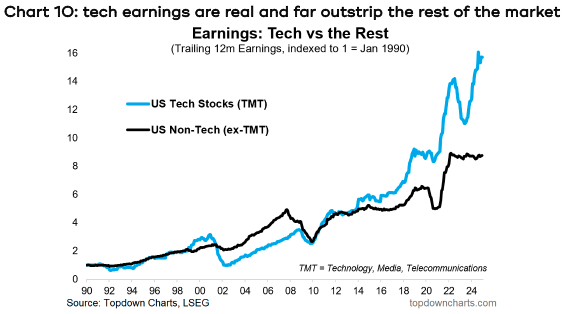
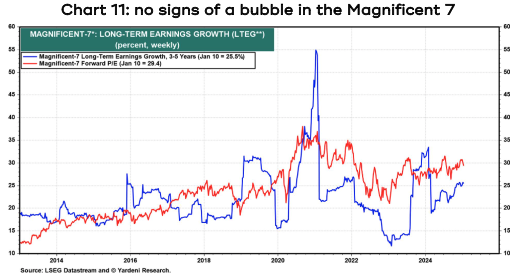
Second, the gap between tech and non-tech earnings is now enormous, and it’s real money, not just blue-sky. Chart 11 compares the long-term (3-5 year) forecast earnings growth for the Magnificent 7 (in blue), which is currently 25.5% per year, to their weighted average forward PE ratio, which is 29.4x. Markets are, of course, forward looking, and that gap is not so high as to be in bubble territory.
The market’s had two great years, it must be time for a breather
There’s an old saying that bull markets don’t die of old age; in other words, something has to happen to stop them. There is no rule that says a market has to take a rest if it’s had a succession of good yearly returns, especially if those returns are underwritten by fundamentals.
There are three things that combine to determine a market’s return in any one year: earnings + dividends + sentiment. Earnings and dividends, which are referred to as the ‘fundamental drivers’ of the share market, are relatively straightforward to forecast, and analysts generally do a good job: the average difference between analysts’ forecast earnings at the start of the year and the final result is about 1.1%. The forecast for 2025 is 11.7% earnings growth.
Dividends are also normally pretty steady at around 1.5% for the US market. So based on fundamentals, you’d expect about a 13% return for 2025.
However, sentiment, which gets reflected in the market’s PE ratio, is impossible to forecast, and it can swing dramatically.
Morgan Stanley research has shown that it’s rare for a market’s PE ratio to drop significantly when earnings are forecast to be above the long-term average of 8% and the Fed’s cash rate is down year on year. At the moment the market is indeed forecasting the Fed will cut rates twice this year.
Some commentators who are bearish on the prospects of the US market argue the PE ratio has to revert to the mean, or long-term average. However, Goldman Sachs has done a lot of work on whether there is any evidence of mean reversion in equity valuations, across all developed markets, and they found none.
Similarly, UBS found that stock valuations show no tendency to mean revert, rather, they have an upward bias during periods of economic growth and then contract sharply in recessions.
Which brings us to the next question…
Will the US economy recess?
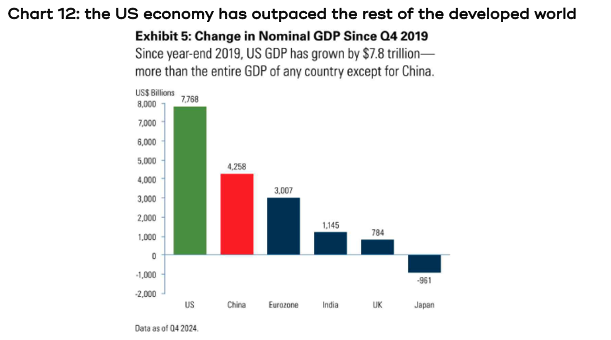
Over the past five years the US economy has far outpaced the rest of the world’s largest economies, as well as Australia’s – see chart 12. In 2024 alone, the US reported 2.8% real GDP growth, compared to 0.8% in the rest of the G6, further cementing its status as the world’s largest economy, accounting for more than a quarter of global GDP.
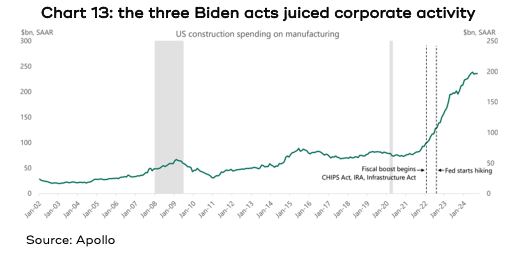
The economy has benefited from a powerful combination of government and corporate spending. The three signature planks of ‘Bidenomics’, the CHIPS Act, the Infrastructure Act and the Inflation Reduction Act, combined to underwrite enormous levels of activity.
Rather than just coming up with a bunch of projects to do itself, the government issued an open invitation for companies to come along with just about any project that helped with the transition to cleaner energy, or reshoring strategically important manufacturing industries, or (re)building key infrastructure, and they’d qualify for government support. The effect on activity is obvious in chart 13, which shows money spent on manufacturing construction, so factories and the like.
On top of that the AI boom has seen some of the biggest companies in the world competing for early starter advantage in what will probably be an ongoing growth area for years to come. Microsoft alone has earmarked $80 billion in spending on data centres, but Google, Amazon and Tesla are jostling as well. Throw in the not so well known companies and there could easily be another half a trillion dollars of corporate spending injected into the economy.
A further boost should come from the Fed at least favouring lowering interest rates further.
An unquantifiable, but nevertheless critical, factor is the sheer creativity and innovation of the US economy compared to its rivals, backed, if not spawned, by a dynamic tertiary education sector: seven of the top 10 universities in the world are US-based, and in 2021, the latest year for which data is available, the US spent over US$800 billion on R&D, compared to US$434 billion for China and US$166 billion for Japan.
What are the risks?
The obvious question is what President Trump will do that might derail that growth. While he has talked about imposing huge tariffs across the board and expelling illegal migrants, both of which would negatively impact the broader economy and potentially boost inflation, until we know for sure, trying to second guess what’s coming, and changing portfolios based on those guesses, has proven in the past to be ill advised.
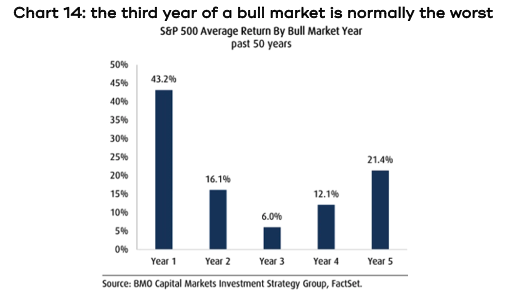
The current US bull market is in its second year (it kicked off when the market bottomed in October 2022). Over the past 50 years the average length of a bull market is five years, but the third year has historically been the worst of the five, with an average return of 6% – see chart 14 – though it also has the broadest range of outcomes.
By the end of 2024, various sentiment indicators were at extreme positive levels, and fund managers had the biggest overweight to US equities in the past 25 years. It didn’t take much of a contrarian to think that could reverse a bit, and they already have after the shaky start to 2025.
In summary
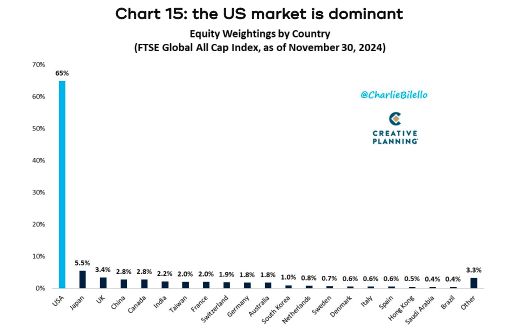
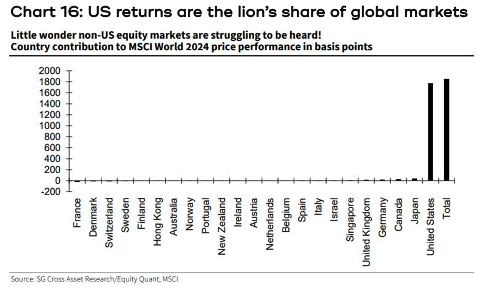
The US share market is not only the proverbial 600-pound gorilla in global markets – see chart 15…
…it’s also where most of the global momentum is – see chart 16.
The Investment Committee remains comfortable recommending clients be overweight US shares in a mixed asset portfolio.
WHAT ABOUT EUROPE?
The European share market is currently trading at close to a record discount to the US on a PE-basis – see chart 17, so it’s reasonable to ask whether you should increase the weighting to Europe compared to the US. However, that’s not a portfolio tilt we are keen on for now.
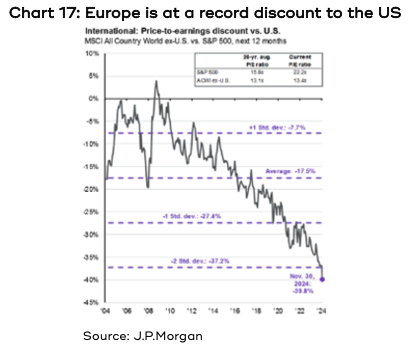
If there were no good reason for Europe to be at a significant discount to the US, then the argument to increase its weighting would make more sense. However, there are various meaningful points of differentiation between them.
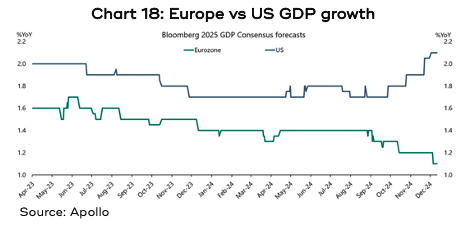
First, as we’ve talked about, GDP growth is just not as strong in Europe as the US – see chart 18.
Second, as we’ve seen, the lion’s share of earnings growth has been generated by the tech and innovation-based sectors, where Europe is almost nowhere to be seen – see chart 19. Indeed, only four of the world’s top 50 tech companies are European, and it’s telling that between 2008 and 2021, close to 30% of the “unicorns” founded in Europe – startups that went on the be valued over US$1 billion – relocated their headquarters abroad, with the vast majority moving to the US.
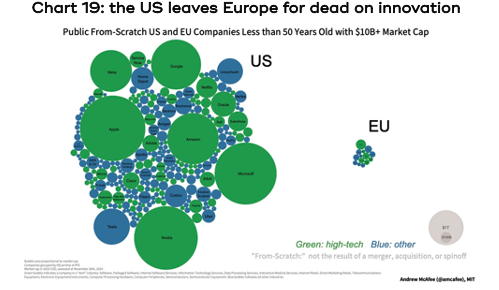
This, of course, ends up being reflected in the share market. Europe’s tech sector, which is forecast to deliver 21% earnings growth in 2025 (after somehow going backwards by 7% in 2024), accounts for only 8% of the S&P Europe 350 index, while financials, with 5% forecast earnings growth, are 21% of the index.
While we certainly don’t advocate having no portfolio exposure to Europe, since there’s always the possibility it will enjoy a good year, for now we see it as more of a nice place to live and a great place to holiday.
SOMETHING TO WATCH
Ten years ago, there was a real buzz around driverless cars. From all the hype it seemed to be a matter of (not a lot of) time and we’d be sipping our morning coffee and reading the news in the back seat of a taxi while a robot whizzed us to work.
Then it all just fizzled out.
But Waymo, which came out of the Google moonshot stable, has quietly and steadily persisted. It now operates 1,000 driverless taxis in four US cities, which between them rack up about 150,000 paid fares and 1 million miles per week!
After covering more than 25 million autonomous miles, Waymo proudly announced that their robots have a far better driving record than humans, with an 88% reduction in property damage claims and a 92% reduction in bodily injury claims compared to human drivers per mile driven (and a couple of those injury claims are still in dispute).
Meanwhile, in China, Apollo Go has a fleet of 400 driverless taxis in Wuhan that had provided more than 8 million rides by the end of 2024. It has plans to increase its fleet to 1,000 vehicles and expand to 11 cities.
Watch that space.
OTHER STUFF
There are various other issues bubbling away in the markets, like sharply higher bond yields, a sharply weaker Australian dollar, razor thin margins for corporate bonds over government bonds, and private equity companies struggling to realise their investments.
In the interests of not turning this article into a book, if you would like to discuss any of these matters, or any of the issues raised in the article, please do get in touch.
